import os
import pandas as pd
from arcgis.gis import GIS
import requests
import geopandas as gpd
import foliumThis is a userguide test notebook
1 Data access

Above is an image by Monet
Use the GRID3 data portal to find data you would like to use: https://data.grid3.org/
Or see a list of GRID3 REST services available: https://services3.arcgis.com/BU6Aadhn6tbBEdyk/arcgis/rest/services
url = "https://services3.arcgis.com/BU6Aadhn6tbBEdyk/arcgis/rest/services/GRID3_NGA_roads/FeatureServer/0/query"
params = {
"where": "1=1",
"outFields": "*",
"outSR": 4326,
"f": "json"
}
resp = requests.get(url, params=params)
data = resp.json()
data.keys()dict_keys(['objectIdFieldName', 'uniqueIdField', 'globalIdFieldName', 'geometryProperties', 'geometryType', 'spatialReference', 'fields', 'exceededTransferLimit', 'features'])
features = data["features"] #use features as the key to get list of features from this dataset
# attributes
df = pd.json_normalize([f["attributes"] for f in features])
geoms = []
from shapely.geometry import LineString
for f in features:
geom = f["geometry"]
if "paths" in geom:
# most road features have one path
geoms.append(LineString(geom["paths"][0]))
else:
geoms.append(None)
gdf = gpd.GeoDataFrame(
df,
geometry=geoms,
crs="EPSG:4326"
)
gdf.head()
| OBJECTID | id | country | iso3 | source_id | class | speed_estimate | speed_estimate_method | road_surface | names | subclass | speed_limits | date | source_acronym | Shape__Length | geometry | |
|---|---|---|---|---|---|---|---|---|---|---|---|---|---|---|---|---|
| 0 | 1 | 08059fffffffffff046f5212a07291c3 | Nigeria | NGA | Overture / OSM | unclassified | 40 | literature review | None | \r | 2025 | OVERTURE_OSM_001 | 5509.471374 | LINESTRING (6.75328 9.90715, 6.75328 9.90717, ... | ||
| 1 | 2 | 08059fffffffffff046ff6a34145d397 | Nigeria | NGA | Overture / OSM | unclassified | 40 | literature review | 2025 | OVERTURE_OSM_001 | 2944.939957 | LINESTRING (6.78229 9.88151, 6.78231 9.88163, ... | ||||
| 2 | 3 | 08059fffffffffff046ff6d48288b3ef | Nigeria | NGA | Overture / OSM | unclassified | 40 | literature review | 2025 | OVERTURE_OSM_001 | 3355.942042 | LINESTRING (6.80792 9.88413, 6.80758 9.8839, 6... | ||||
| 3 | 4 | 08059fffffffffff046ff775b238a897 | Nigeria | NGA | Overture / OSM | unclassified | 40 | literature review | 2025 | OVERTURE_OSM_001 | 3808.948460 | LINESTRING (6.81537 9.84995, 6.81475 9.84981, ... | ||||
| 4 | 5 | 08059fffffffffff046fff05b325608b | Nigeria | NGA | Overture / OSM | tertiary | 50 | GPS | 2025 | OVERTURE_OSM_001 | 7136.589369 | LINESTRING (6.75366 9.82817, 6.75391 9.82827, ... |
gdf.plot()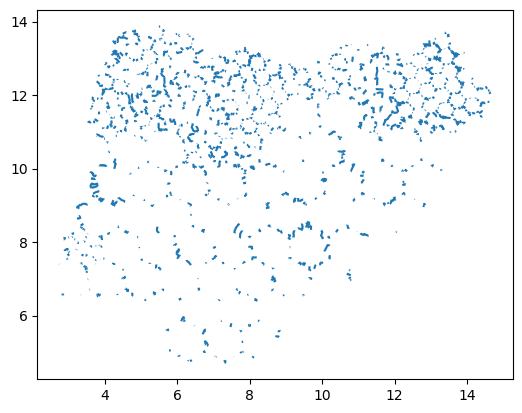
2 Using Folium to visualize data
The package folium is a great way to visualize spatial data in Python. Below is an example of how to use it.
# center the map on your data
minx, miny, maxx, maxy = gdf.total_bounds
center = [
(miny + maxy) / 2,
(minx + maxx) / 2
]
m = folium.Map(
location=center,
zoom_start=8,
tiles="CartoDB positron" #"OpenStreetMap" # basemap
)
folium.GeoJson(
gdf,
name="GRID3 Roads",
popup=folium.GeoJsonPopup(
fields=list(df.columns)[:5] # limit fields
)
).add_to(m)
folium.LayerControl().add_to(m)
mMake this Notebook Trusted to load map: File -> Trust Notebook